Utilisation Monitoring
- This section provides detailed breakup of machine utilisation for the selected month. By default, the current month's data is displayed.
- The data is presented in two tabs:
- Pareto Analysis
- Utilisation Analysis
- There are three filters available: Category, Machine and Month.
- Select a required machine category from the dropdown. The machine filter will list machines as per the selected category.
- Select a required machine from the dropdown.
- Select the required month from the dropdown. The section will get updated as per the filters.
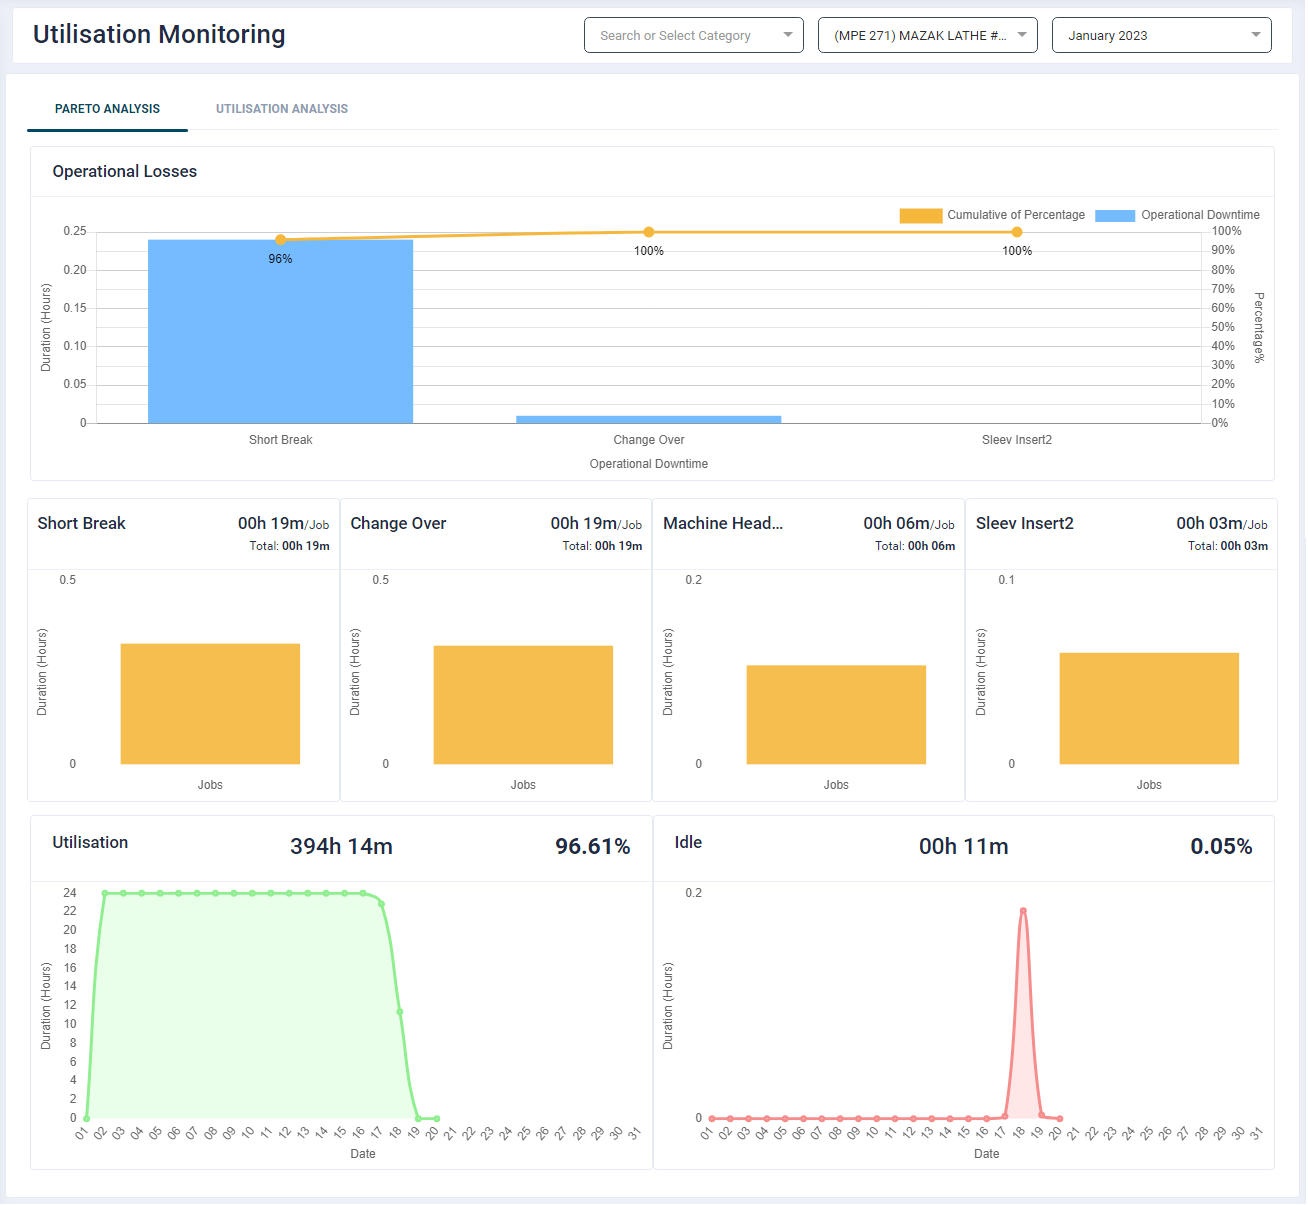
Pareto Analysis
Operational Loss Chart
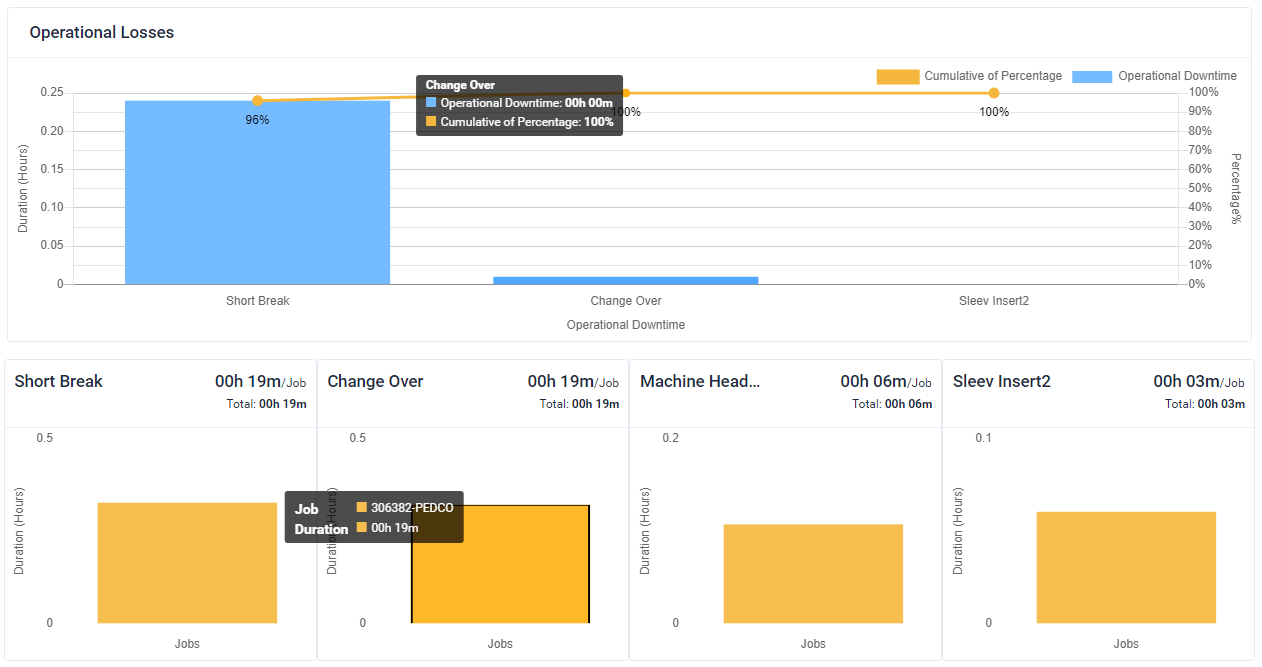
These charts provide downtime statuses for the selected work centre and the month.It helps in analysing time taken in particular statuses.
Utilisation and Idle Chart
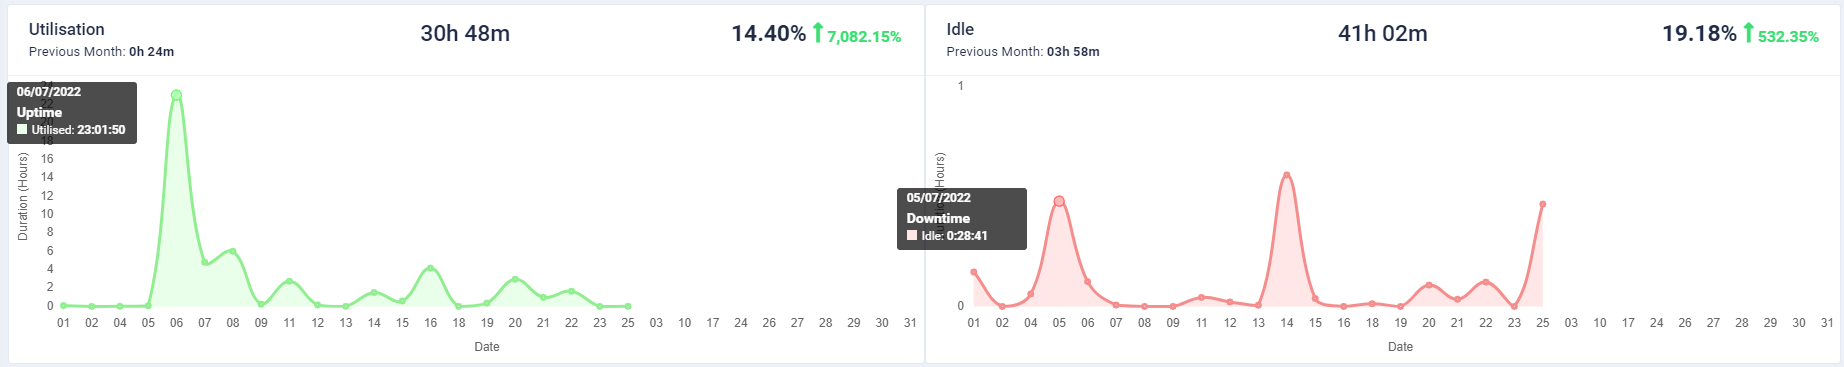
- These charts show Previous month average Utilised and Idle value.
- They provide a comparison to previous month’s utilisation/Idle values.
Utilisation Analysis
Click the Utilisation Analysis tab to view charts of business days for the selected time period. In the event a machine is utilised during non-business days like weekend or holidays then for those dates we only show utilised data.
Daily Utilisation Chart
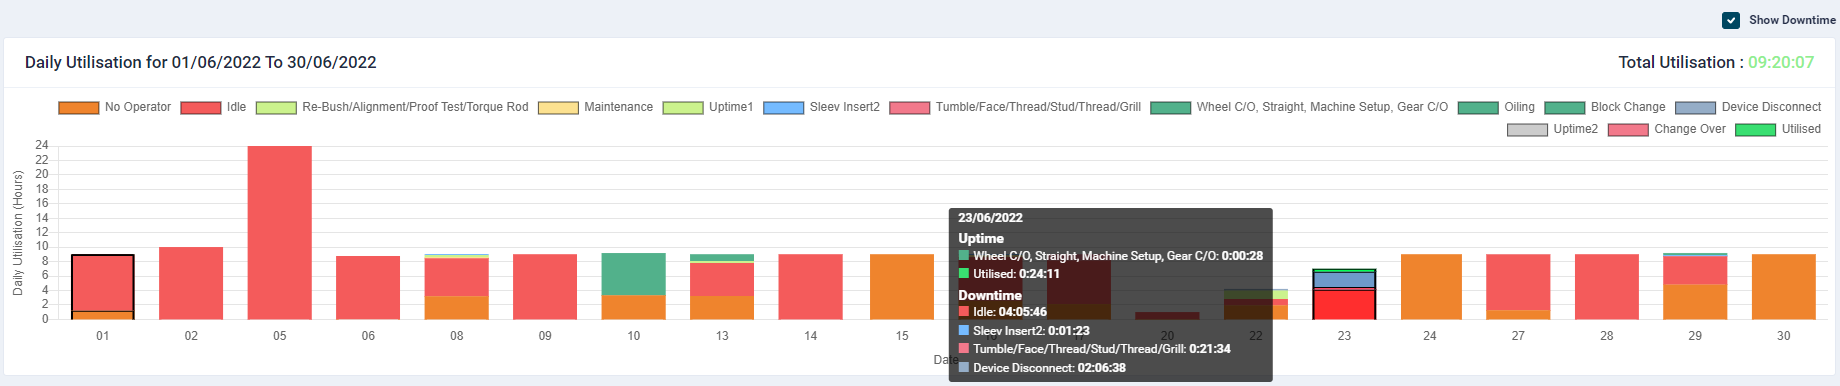
- The user has the option to view downtime hours of a machine by clicking the Show Downtime check box.
- The first bar is the default selection.
- On click, all the bar charts will display downtime (for business hours) in each machine status for the selected time duration.
- This detail can be viewed by hovering over each bar in the Total Utilisation and Hourly Utilisation Summary charts.
- Detailed information is provided in the Downtime table at the end of the page.
- Users who have configured multiple shifts will be able two see shift wise utilisation data.
- By default, the charts show data of all the shifts. As per the selected shift the chart and data on Job Wise Summary and Downtime table will be displayed.
When viewing multiple shift data, if time period ‘Today’ is selected, then the Shift Start and End markers will be shown on Total Utilisation chart. However, the Hourly Utilisation Summary chart will not be displayed.
If multiple shifts are added just for a particular day, then the feature will be available only for the same day.
Hourly Utilisation Summary Chart
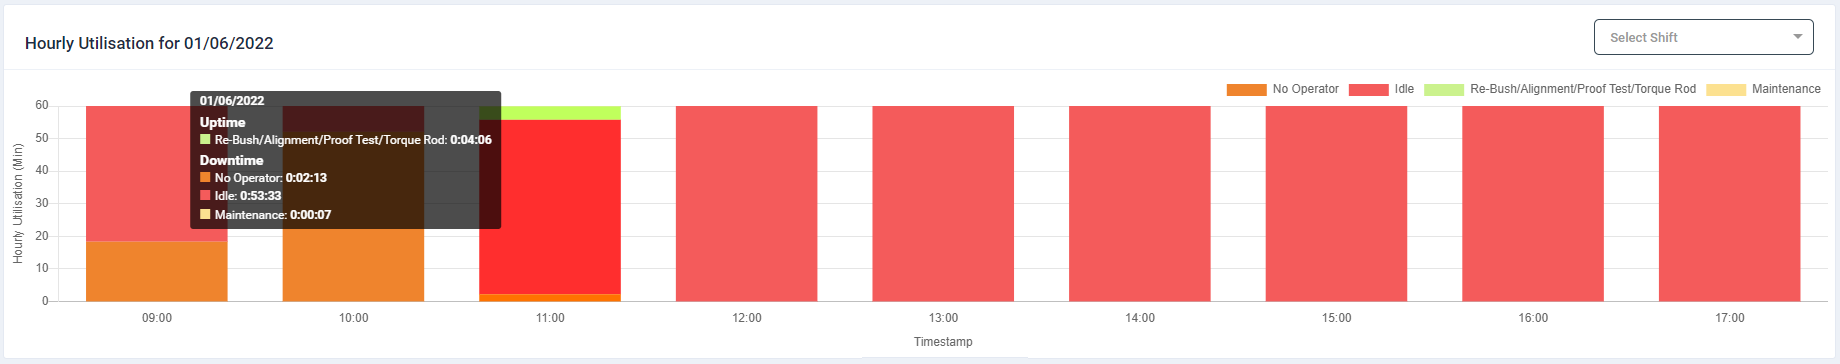
- This chart provides an hourly break up for the machine utilisation bar selected in the Utilisation chart.
- For users who have multiple shifts, the charts on this section will show a shift start - end marker and a Shift selection dropdown for various time period selection.
Job Wise Summary
Uptime
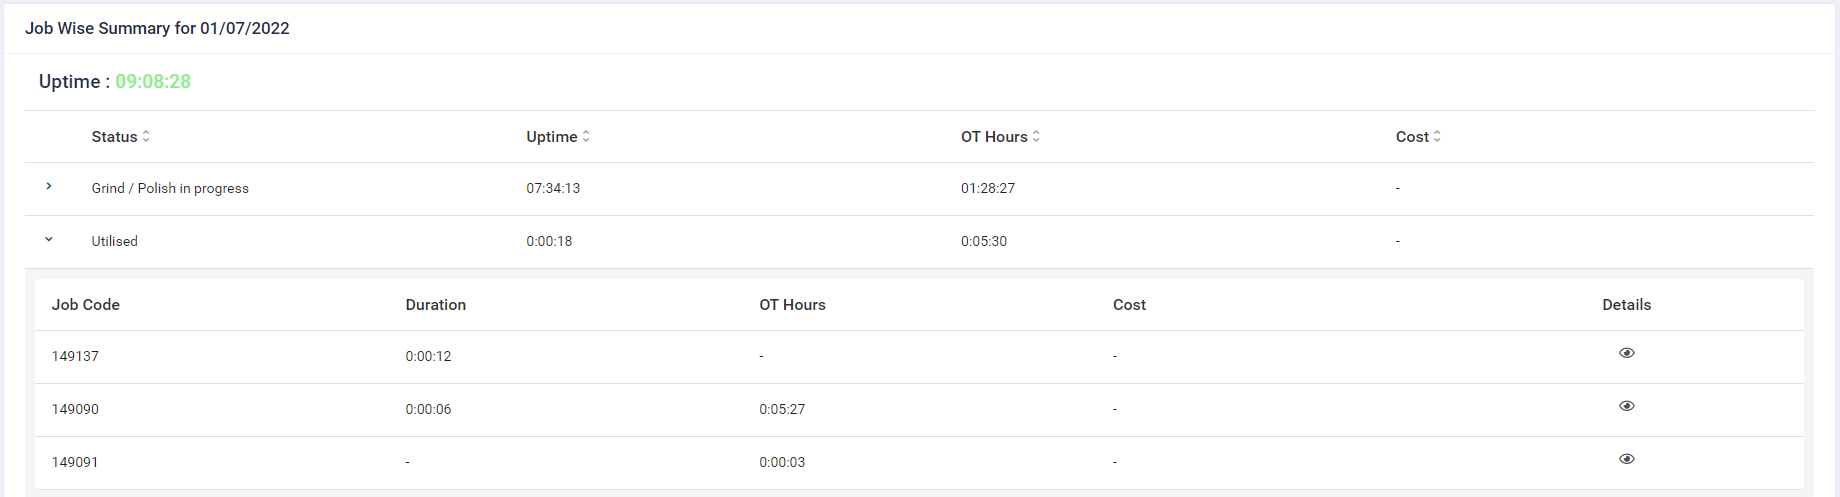
The Uptime table indicates on which Job Code the machine was utilised, for what Duration, the OT hours and the Cost.
- Clicking on the Expand icon against each uptime status provides uptime details by Job Code, Duration, OT Hours and Cost
- The cost is based on the the Machine Cost specified in machine configuration under Settings section.
- If OT Billable Amount is specified, then it will be included in the cost displayed in Job Wise Summary table.
Uptime Details
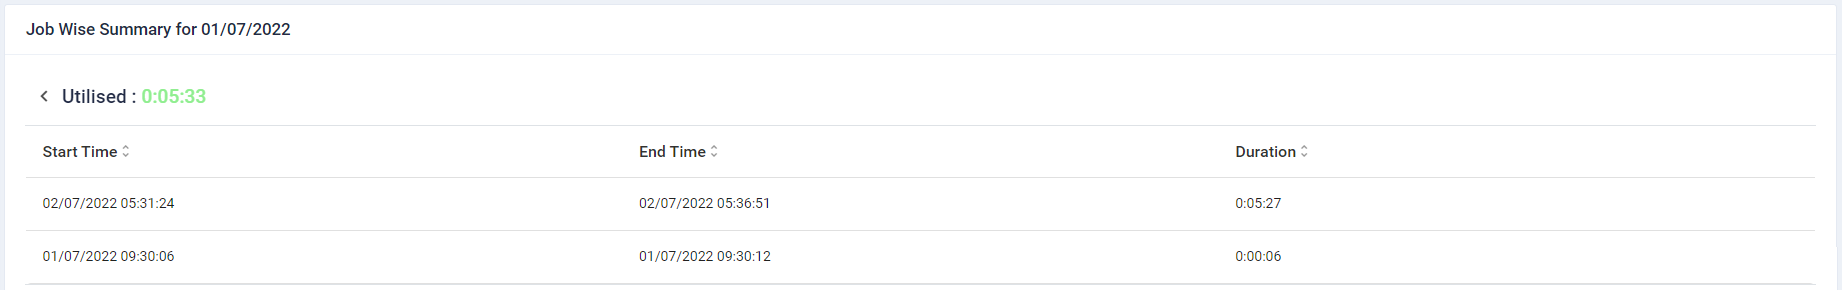
- Clicking on the Details icon provides a detailed timewise log of the downtime i.e. Start Time, End Time and Duration.
Downtime
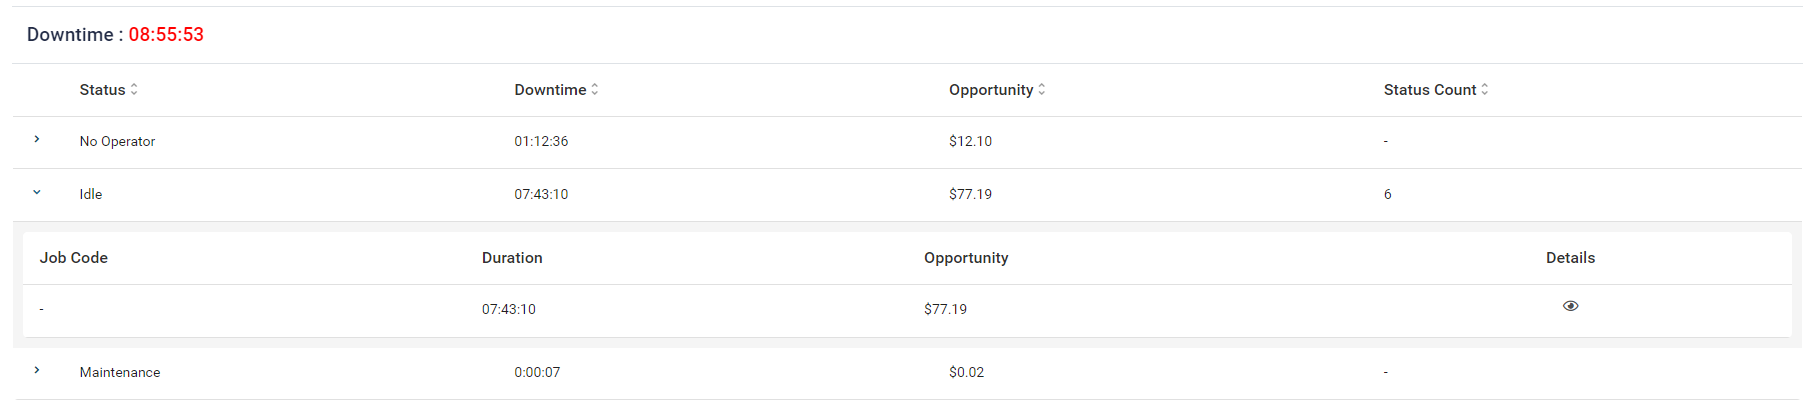
- This section provides details of all the downtime durations in the machine's life cycle statuses.
- Clicking on the Expand icon against each downtime status provides downtime details by Job Code, Duration, Opportunity (i.e. downtime cost to the company).
Downtime Details
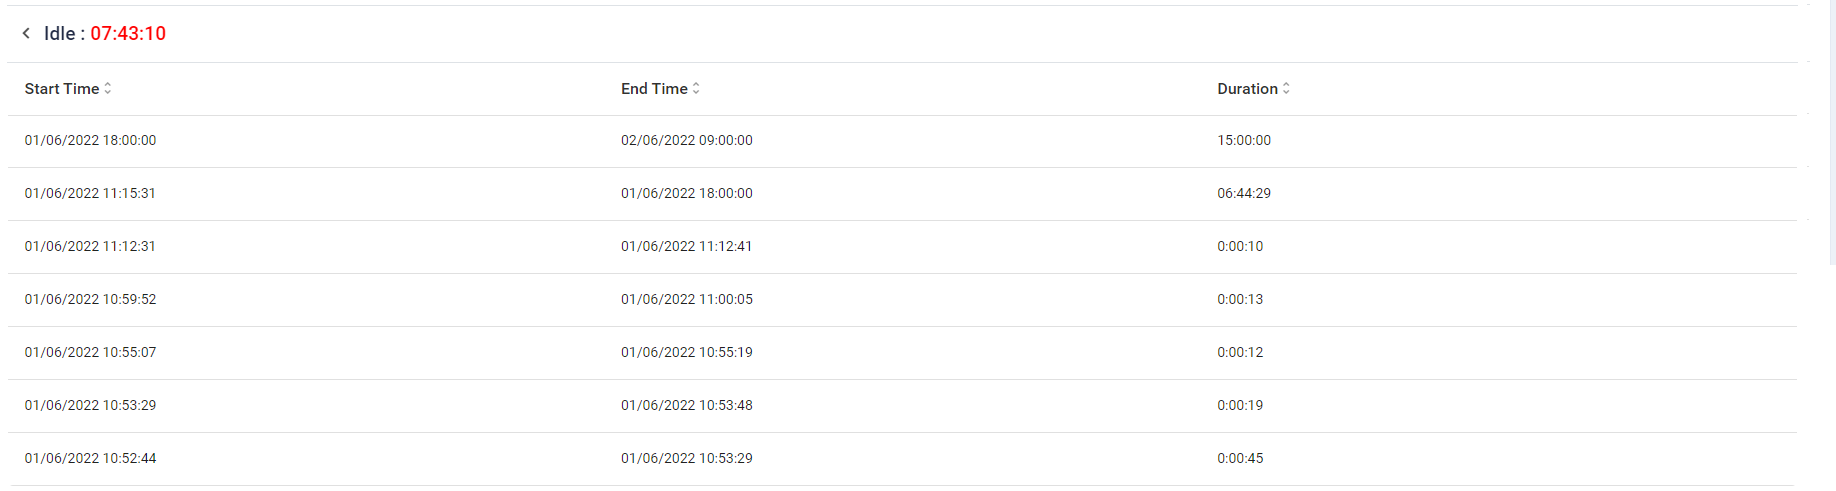
- Clicking on the Details icon provides a detailed timewise log of the downtime i.e. Start Time, End Time and Duration.