OEE Analytics
OEE Analytics shows monthly as well as daily OEE. The OEE for all work centres are calculated and profiled on a daily basis.

- Data of the first work centre listed in the Work Centre dropdown is displayed by default for the current month.
- The first table provides OEE data such as Availability, Performance, Quality, OEE, Cash and Delivery.
OEE Factors
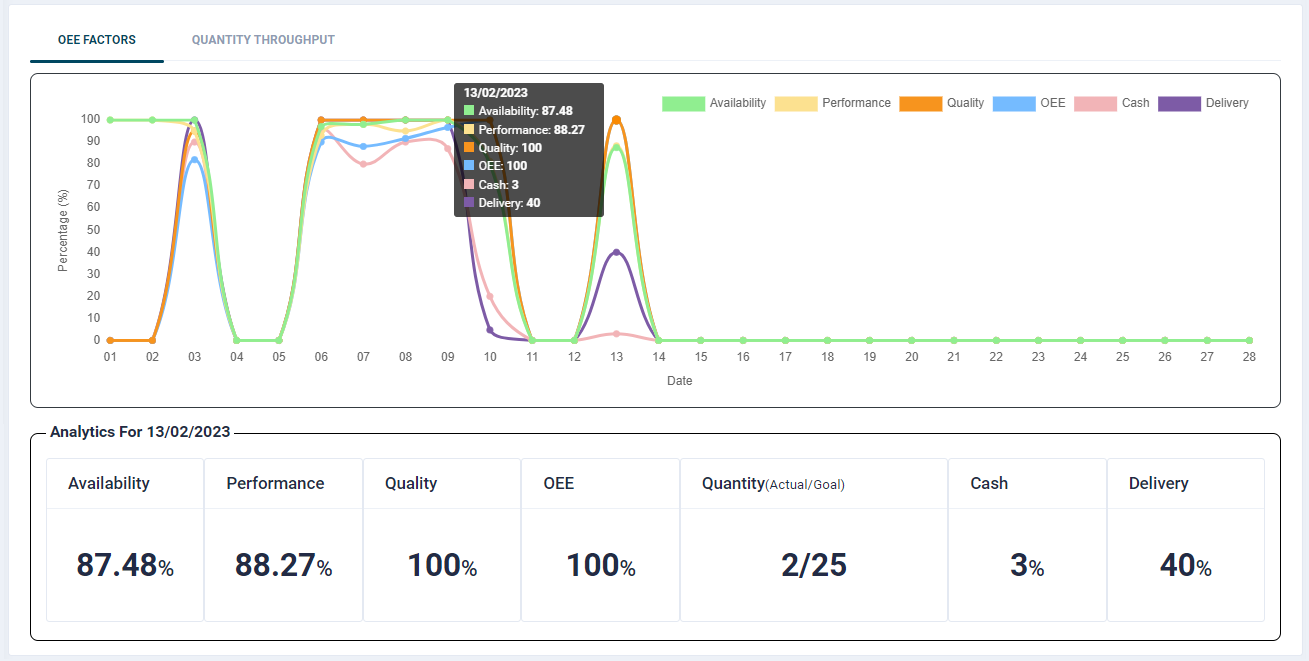
- OEE Factors chart displays a daywise analytics of the work centre.
- Clicking a specific day on the graph will display its corresponding data including the Actual and Goal Quantities in the table below it.
Quantity Throughput
This chart displays data of actual manufactured quantity against the goals.
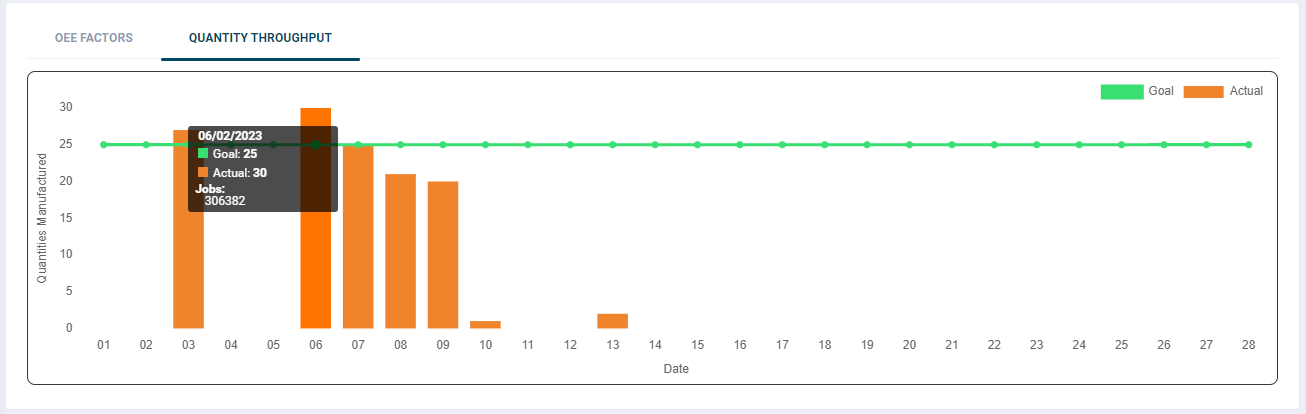
- The vertical bar corresponds to date-wise actual quantity manufactured. The horizontal line corresponds to the goal configured for selected work centre.
- On hovering over the bar displays a tooltip with Goal quantity, Actual quantity and Job codes (if available)