Long Term View
The section presents a list of all the jobs categorised by department along with their respective components, operations and schedule dates.
Gantt Chart
- The board can be filtered by the following timelines
- Fortnight - This timeline will show data of the current fortnight with partition on dates and user can traverse backward or forward on fortnightly basis.
- Month - This is the default duration setting. This timeline will show data of current month with partition on dates and with user can traverse backward or forward on monthly basis.
- 3 months - This timeline will show data of immediate previous month, current month and next month with partition as currently done and user can traverse backward or forward on 1 month basis.
- If the timeline view is changed, it would be saved as preference and display the same timeline each time the page is revisited.
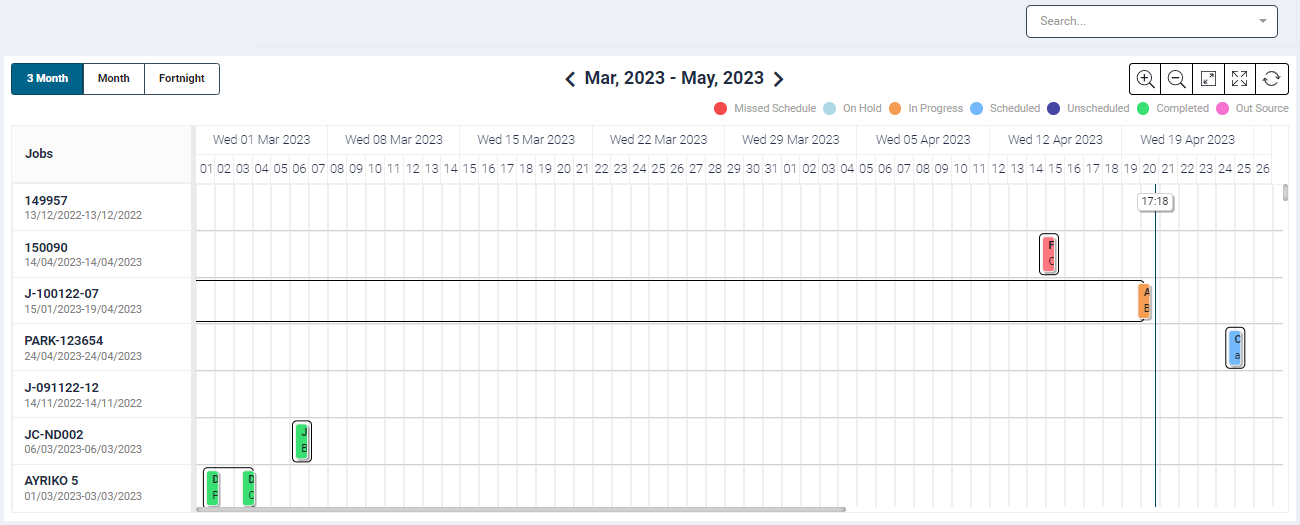
Gantt Chart Details
- The gantt chart displays operation tiles for the respective job.
- The tile colour are based on the job status. The legends are displayed at the top of the chart
- Missed Schedule
- On Hold
- In Progress
- Scheduled
- Unscheduled
- Completed
- Out Source
- To indicate a missed schedule, we have implemented a visual cue in the Gantt Chart.
- The missed schedule operation tile will blink with its original color, switching between red and pink to draw attention to the delay.
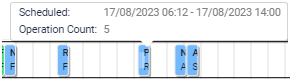
- On hover over, a tooltip displays the schedule time and operation count.
- When multiple operations are scheduled on the same day, they will be consolidated into a single tile. The tile's start time will correspond to the first operation's start time, and it will extend until the last operation's end time for that day.
- The tiles will not expand beyond the day's working hours or over weekends. If a job scheduled for the day extends to the next day, the tile will end at the last shift's end time for that day. For 24-hour clients, there will be a single tile for that day, ending at midnight, and a new tile will be displayed for the next day.
- The tiles on the Gantt Chart will be displayed using a light blue color, which is the standard color for indicating scheduled components.
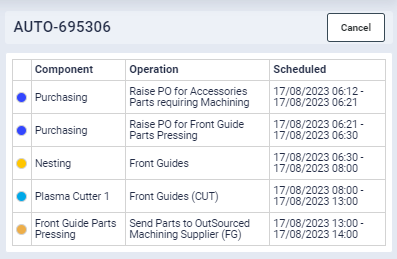
- Clicking on the tile will open a sidebar panel where in it would show all the operations listed for the day along with their scheduled time and the category-based color details.
Search
- The Search feature allows you to search data by Job Code, Customer Name, Order Number, Serial Number and Order Date
- Enter the keywords in the search box and select the required search parameter.