Gantt chart
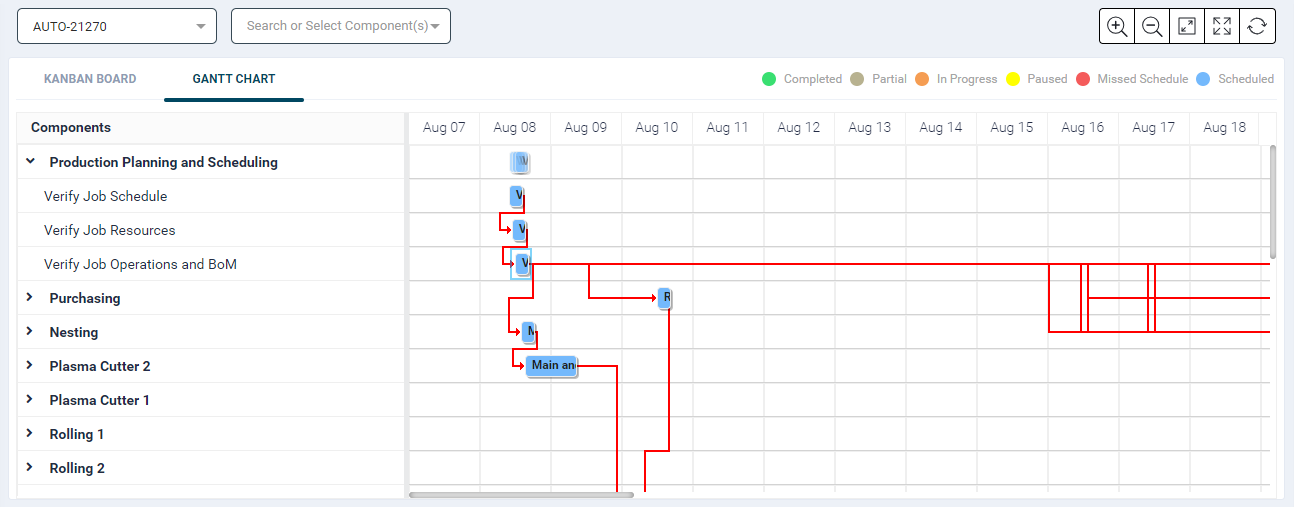
- The Gantt Chart displays scheduled jobs and their predecessors, allowing the user to view one job at a time.
- When selecting a job from the dropdown list, the chart shows the timing based on the scheduled start and end time.
- The chart's colors are based on the job's status, and it displays unique components and their corresponding operations.
- The chart shows red lines based on predecessors, indicating task dependencies.
- The chart provides a clear overview of the job's progress and current phase in real-time.
- The functionality allows selecting a job and displaying all unique components associated with it.
- It supports multiple components selection filter and shows predecessor components accordingly.
- The Scheduled Job dropdown enables users to select a single job and view its details on the Gantt chart. The left-side panel displays unique components, and the Gantt view shows scheduled job operations from start to end.
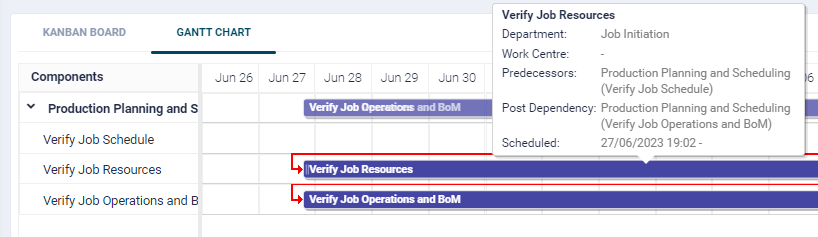
- When hovering over an item, the chart displays essential details, including Operation, Department, Work Centre, Predecessors, and Scheduled time range (From - To).
- The Selected Job - Components filter allows showing selected components and their predecessors, considering all operations, regardless of dependencies.
- Collapsible components display operation-based predecessors.